Near Analytics: Cheatsheet
Cheat Code for Near Protocol Analytics.
Did you know you can access Near Protocol's mainnet analytics using SQL to query things like:
> Daily Active Accounts
> Daily Active Contracts Count
> Daily Gas Used
> Deployed Contracts
> *Near Ecosystem Entities*
*Data as of 12/25/21
Connecting to the Near Analytics DB:
If you do not have pgAdmin or another SQL database query tool - you will need to download one (Dbeaver)
You will need the credentials from the Near Github which can be found here:
https://github.com/near/near-analyticsWe will be using the mainnet credentials
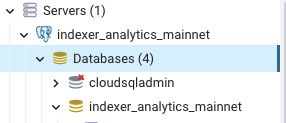
Using pgAdmin - click on “Servers” > Create > Server
General:
Connection:
Username: public_readonly
Password: nearprotocol
Host: 34.78.19.198
Maintenance DB: indexer_analytics_mainnetSave - your connection should be successful
Tables Available:
Example SQL Queries
Let us explore some sample SQL queries you can run on the tables:
Daily Active Accounts Count & Weekly Active Accounts
select * from daily_active_accounts_count
order by collected_for_day desc
This query will show the date, and active accounts count over time from most recent to oldest:
You can see here that on 12/25/21 the active accounts count was 25,503 - these numbers might change depending on when you pull the data.
select
*
from daily_active_accounts_count
where collected_for_day >= '2021-01-01'
order by active_accounts_count desc
limit 1
This query will tell you the date on which there were the most active accounts, from this dataset we can see that it was on 9/15/21: 53,307
Top 3 Active Accounts by week: 9/6/2021, 9/13/2021, 12/20/2021
Some notable Near Protocol Tweets from September 2021:
Daily Gas Used
SELECT
DATE_PART('week', collected_for_day) as week,
sum(gas_used) as sum_gas
FROM DAILY_GAS_USED
where collected_for_day >= '2021-01-01'
group by 1
order by sum_gas desc
Suppose you want to sum the gas used by week in 2021, you can use the query above to sum the gas by week for 2021, and then order by the sum of gas, sorted in descending order. This will show you the weeks in which most gas was used.
We’ve seen some of the highest gas usages in the past few days as well:
Daily Ingoing Transactions Per Account Count
select *
from
daily_ingoing_transactions_per_account_count
where collected_for_day = '2021-12-25'
order by ingoing_transactions_count desc
Daily Outgoing Transactions Per Account Count:
Near Ecosystem Entities Table
Probably one of the most interesting tables. This table has information on Near Ecosystem entities and breaks each entity into various categories: App, NFT, Guild, Defi, DAO. Some entities may have multiple labels but this does help you, filter through entities you are interested in. Let’s check out entities that fall under “Defi”:
SELECT
count(*)
from near_ecosystem_entities
where is_defi is True
We can see that there are 38 entities as of today that have registered under “Defi” for the Near Ecosystem.
Full list of entities:
SELECT
title
from near_ecosystem_entities
where is_defi is True
Onomy Protocol, Stake.gg, Ref Finance, Amplify Art, Conceal Protocol, CheddarFi, Taker Protocol, Tip Jar Live, Open DeFi, Rainbow Bridge, SushiSwap, Burrow, Pulse, Vaporwave Finance, Cannabis Genome DAO, DePocket, Spin, Berry Club, AntiMatter, Skyward Finance, Picipo, NearPad, Hapi, ChainScore, Meta Pool, IndexZoo, SmartPad, Wizards Guild, iBetYou, Moo Pay, Angle Protocol, Solace.Fi, MTVRS, Marnotaur, TiTi Protocol, Emiswap, NEARswap, Patchwork
Some additional insights into Near Ecosystem Entities:
Top 10 Categories of Near Ecosystem Entities:
Entities with more than 6 categories listed:
Status of Ecosystem Projects:
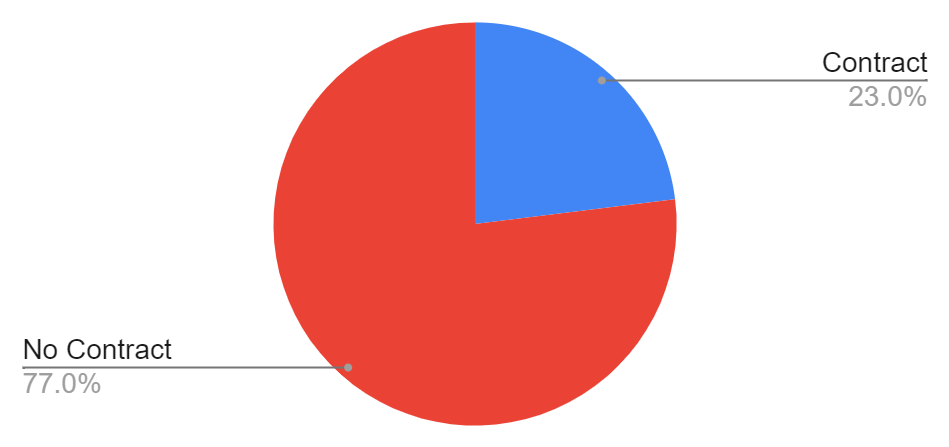
Ecosystem Projects that Have Contracts:
Near Ecosystem Project Categorizations:
Near Ecosystem Live Websites:


